How to Collect A SAML Response For SSO Debugging (KBA6076)
KBA
KBA# 6076Applicable Delphix Versions
- Click here to view the versions of the Delphix engine to which this article applies
-
Major Release All Sub Releases 6.0 6.0.0.0, 6.0.1.0, 6.0.1.1, 6.0.2.0 5.3
5.3.0.0, 5.3.0.1, 5.3.0.2, 5.3.0.3, 5.3.1.0, 5.3.1.1, 5.3.1.2, 5.3.2.0, 5.3.3.0, 5.3.3.1, 5.3.4.0, 5.3.5.0 5.3.6.0, 5.3.7.0, 5.3.7.1, 5.3.8.0, 5.3.8.1, 5.3.9.0 5.2
5.2.2.0, 5.2.2.1, 5.2.3.0, 5.2.4.0, 5.2.5.0, 5.2.5.1, 5.2.6.0, 5.2.6.1
How to Task
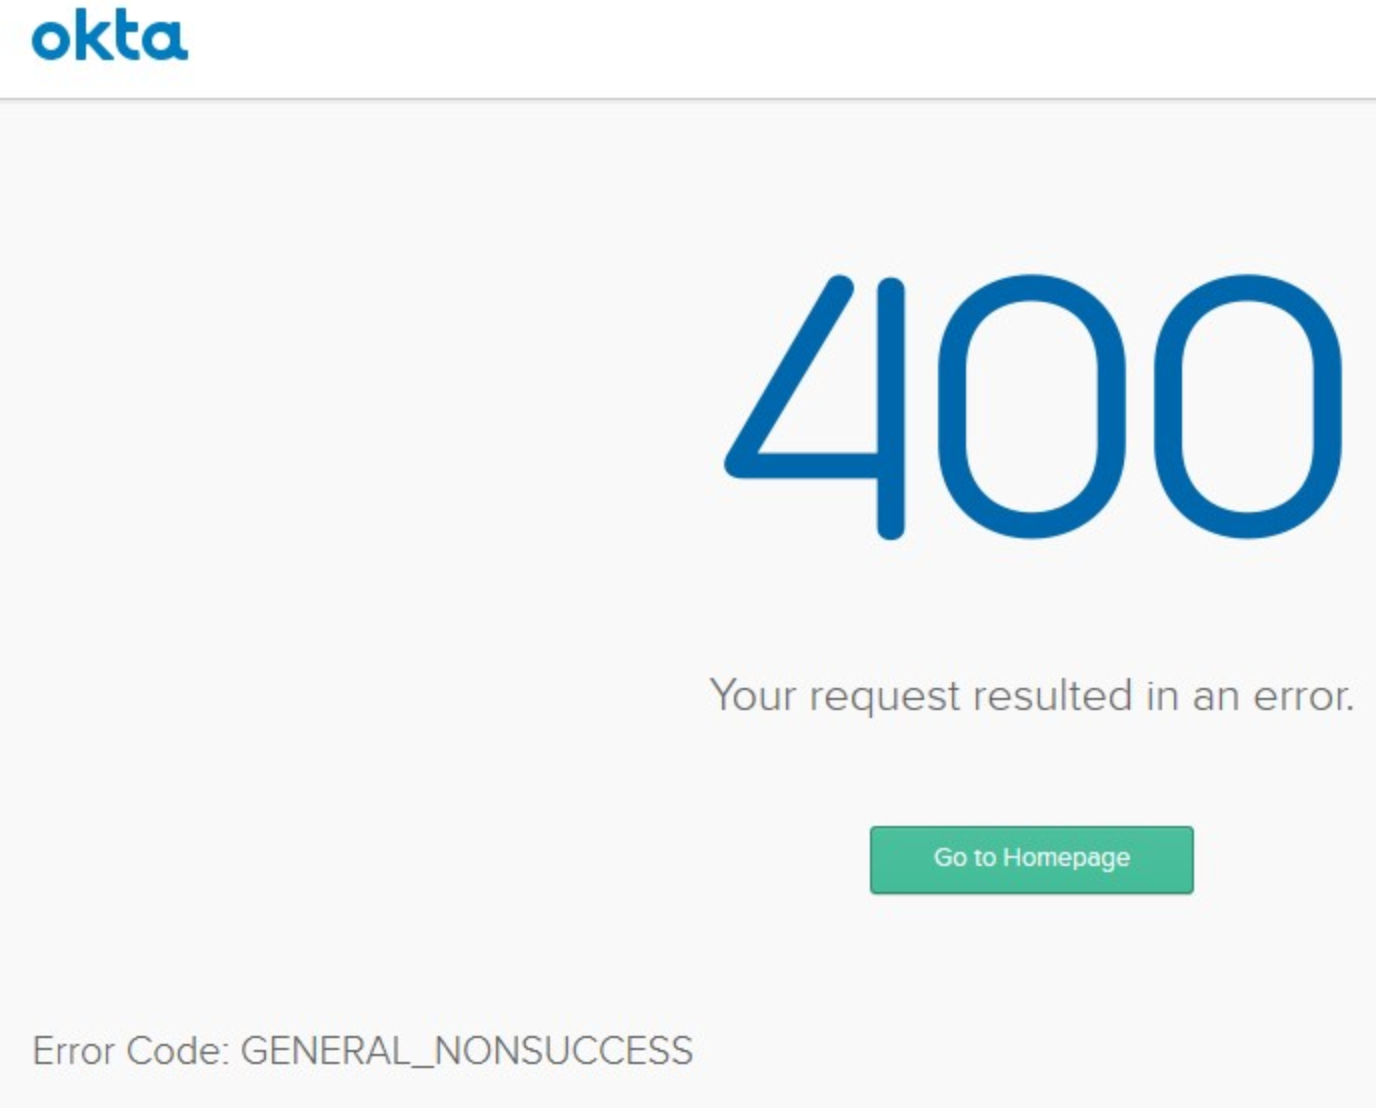
This document discusses the procedure to collect and decode a SAML trace for SSO and/or Data Control Tower Engine login troubleshooting. This may be required in conjunction with other Delphix Support troubleshooting when general Okta or other IdP events are encountered, such as 400: GENERAL_NONSUCCESS.
Prerequisites
Browser add-on are recommended for ease of use, though these may not be available for ad-hoc installation depending on administrative restrictions.
Delphix recommends SAML-tracer or others listed at https://www.samltool.com/saml_tools.php
Uninett SAML-tracer - Chrome Web Store
Uninett SAML-tracer - Firefox Add-Ons
Firefox and Chrome - SAML-tracer
- Open a new browser window.
- Click the SAML-Tracer extension button.

A new SAML-tracer window displays:

In the SAML-tracer toolbar, the blue button highlight indicates an active selection. In this example, Pause is selected, so this should be clicked again to un-Pause data collection.
- Reproduce the issue (login, etc).
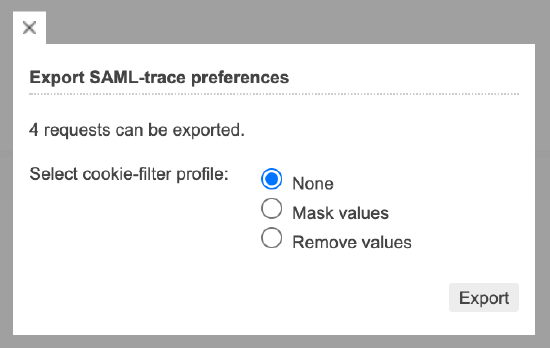
- Once the issue is reproduced, click Export in the SAML-tracer toolbar. In the Export SAML-trace preferences, select None for "Select cookie-filter profile", and then click Export. Save the file to a known location. This JSON export can be attached to the active Support case for further review.
Google Chrome - Developer Tools
The SAML response can be captured by first opening Developer Tools, click the Network tab, and enable Preserve Log option:

Once enabled, reproduce the behavior of concern. When the problem is reproduced, the Network log can be filtered to only display SAML activity by clicking the Filter icon:

and adding "SAML" to the text filter box (this should not be case sensitive):

Selecting the network event under Name column will display details for the selected event. Scrolling to the bottom of the right-hand pane, the SAML response can be found.
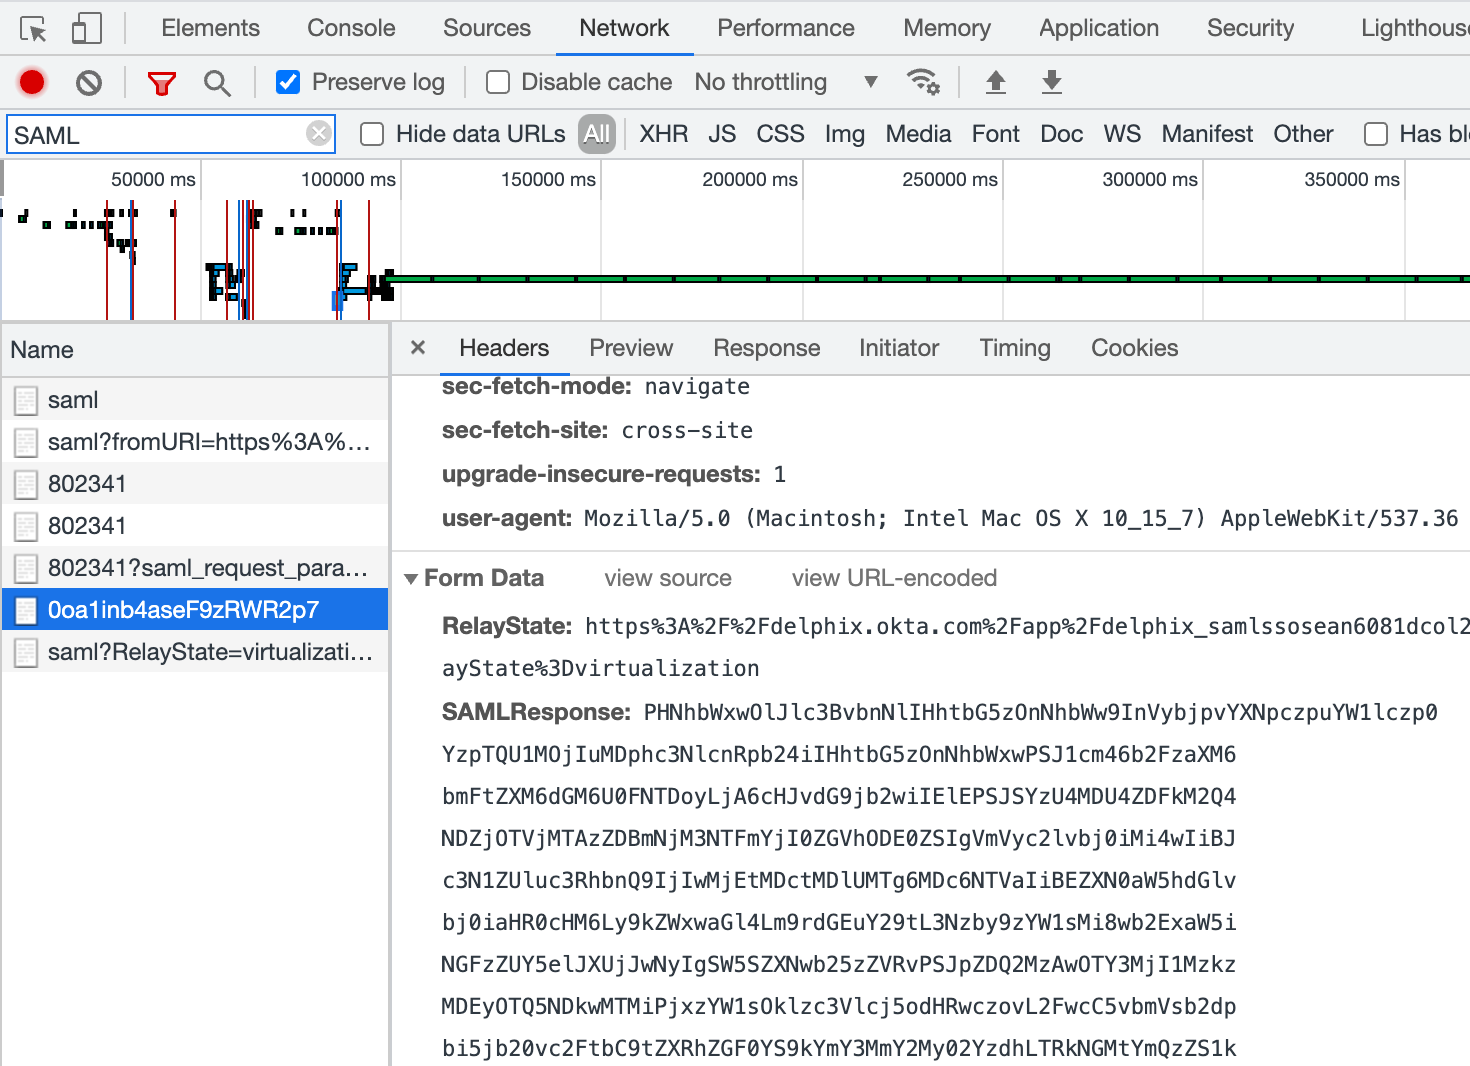
This SAML response can then be copy+paste to notepad of choice, or added to Support case as needed for further review.
Alternatively, if there are difficulties in locating the event of concern, the log can be exported in its entirety for Support review by right-clicking on any line in the Network tab content (clicking outside of a populated line won't display the required options), and select the menu option "Save all as HAR with content".
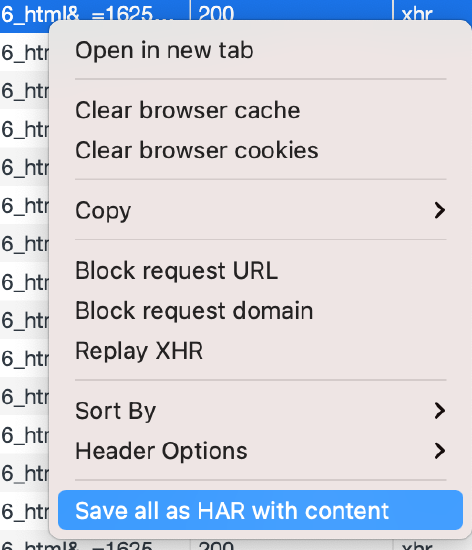
The resulting file can be attached to the Support case, if file size is less than 20MB. Otherwise, the file can be transferred via upload.delphix.com.
Firefox - Developer Tools
The SAML response can be captured by first opening Developer Tools, click the Network tab:

Then, enable Persist Logs option by clicking the Settings (gear) icon and select "Persist Logs"
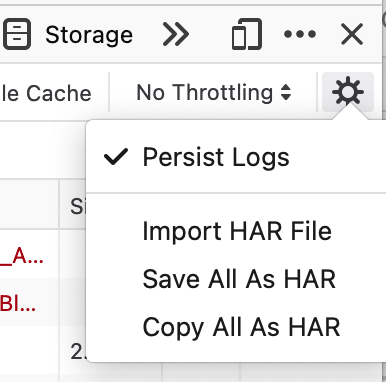
Once enabled, reproduce the behavior of concern. When the problem is reproduced, the Network log can be filtered to only display SAML activity by adding "SAML" to the filter text box (this should not be case sensitive):

Selecting the network event in the Network panel will display details for the selected event.
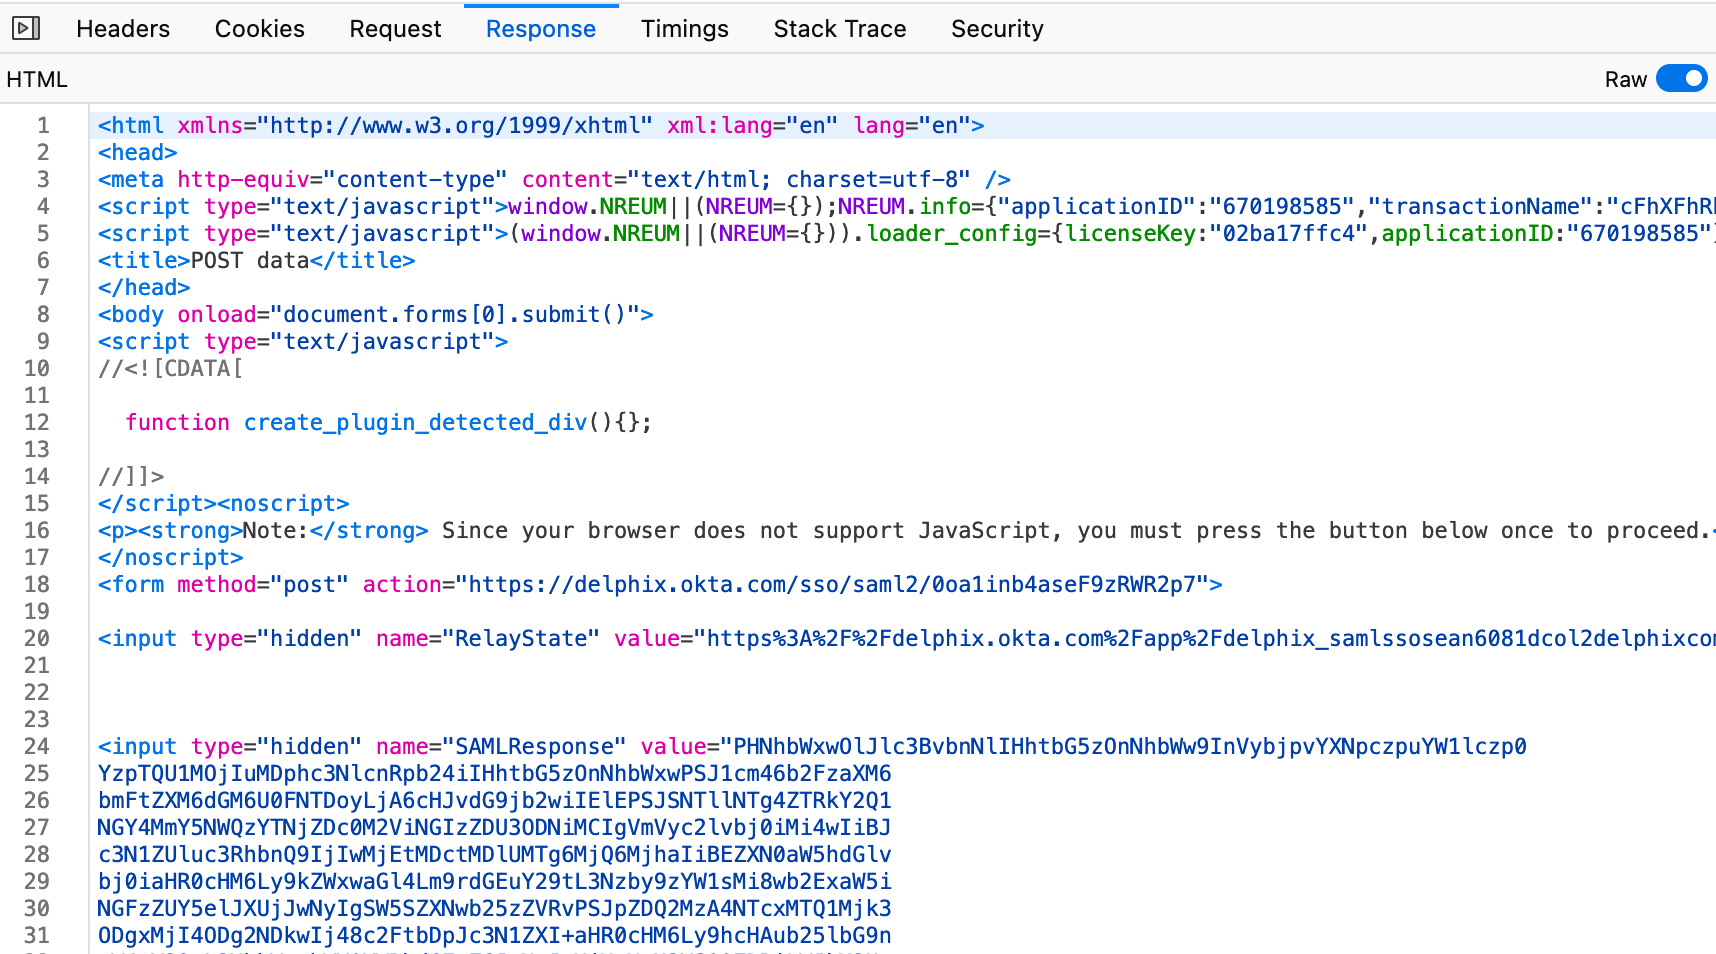
Click the Response tab on the right-hand panel to view the SAML response data:

Note, the first time this is performed, a JavaScript warning may appear:

If this occurs, simply toggle the "Raw" slider on right-hand side of panel to view the raw data. This SAML response (indicated on line 24 in example below, with name="SAMLResponse" can then be copy+paste to notepad of choice, or added to Support case as needed for further review.
Alternatively, if there are difficulties in locating the event of concern, the log can be exported in its entirety for Support review by right-clicking on any line in the Network tab content (clicking outside of a populated line won't display the required options), or click the setting (gear) icon and select the menu option "Save All As HAR"
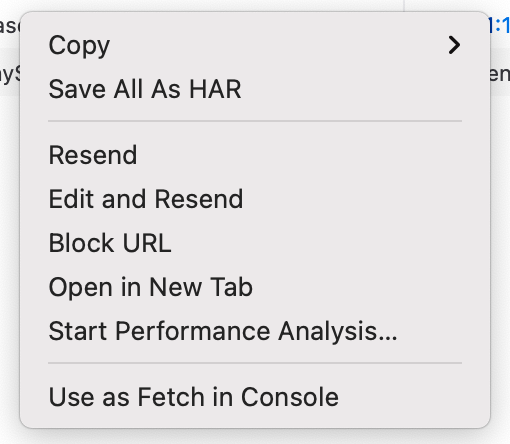
The resulting file can be attached to the Support case, if file size is less than 20MB. Otherwise, the file can be transferred via upload.delphix.com.
Related Articles
The following articles may provide more information or related information to this article:
- https://www.samltool.com/decode.php
- https://developer.chrome.com/docs/devtools/
- https://developer.mozilla.org/en-US/docs/Tools
- https://www.ibm.com/support/pages/how-decode-saml-response-when-it-encoded
- https://snowflakecommunity.force.com/s/article/How-To-Obtain-a-SAML-Response-And-Use-It-To-Troubleshoot-SSO-Issues
