Collecting Perfmon Metrics Using a Counters Template (KBA8864)
KBA
KBA# 8864Applicable Delphix Versions
- Click here to view the versions of the Delphix engine to which this article applies
-
Major Release All Sub Releases 6.0 6.0.0.0, 6.0.1.0, 6.0.1.1, 6.0.2.0, 6.0.2.1, 6.0.3.0, 6.0.3.1, 6.0.4.0, 6.0.4.1, 6.0.4.2, 6.0.5.0, 6.0.6.0, 6.0.6.1, 6.0.7.0, 6.0.8.0, 6.0.8.1, 6.0.9.0, 6.0.10.0, 6.0.10.1, 6.0.11.0, 6.0.12.0, 6.0.12.1
5.3
5.3.0.0, 5.3.0.1, 5.3.0.2, 5.3.0.3, 5.3.1.0, 5.3.1.1, 5.3.1.2, 5.3.2.0, 5.3.3.0, 5.3.3.1, 5.3.4.0, 5.3.5.0, 5.3.6.0, 5.3.7.0, 5.3.7.1, 5.3.8.0, 5.3.8.1, 5.3.9.0 5.2
5.2.2.0, 5.2.2.1, 5.2.3.0, 5.2.4.0, 5.2.5.0, 5.2.5.1, 5.2.6.0, 5.2.6.1
5.1
5.1.0.0, 5.1.1.0, 5.1.2.0, 5.1.3.0, 5.1.4.0, 5.1.5.0, 5.1.5.1, 5.1.6.0, 5.1.7.0, 5.1.8.0, 5.1.8.1, 5.1.9.0, 5.1.10.0
5.0
5.0.1.0, 5.0.1.1, 5.0.2.0, 5.0.2.1, 5.0.2.2, 5.0.2.3, 5.0.3.0, 5.0.3.1, 5.0.4.0, 5.0.4.1, 5.0.5.0, 5.0.5.1, 5.0.5.2, 5.0.5.3, 5.0.5.4
How to Collect Perfmon Metrics Using the Delphix Counters Template
Delphix Support may request Windows OS metrics to help troubleshoot performance issues. These metrics can be collected using the Windows Performance Monitor ("perfmon").
To assist in capturing the relevant data Delphix has created a template counters file containing the minimum counters generally required to progress performance related issues. The following instructions detail how to configure a Data Collector Set using the Delphix Template. The captured metrics can be written to a file or CSV.
The Delphix template is not a necessity, it is also possible to manually create a collector set. The following is a useful list of counters that should be included:
\Processor(*)\% Processor Time
\Processor(*)\% Privileged Time
\Processor(*)\% Idle Time
\Processor(*)\% Interrupt Time
\Processor(*)\% User Time
\VM Processor(*)\% Processor Time
\VM Processor(*)\CPU stolen time
\VM Memory\Memory Ballooned in MB
\VM Memory\Memory Reservation in MB
\VM Memory\Memory Swapped in MB
\Memory\Available Bytes
\Memory\Cache Bytes
\Memory\Pool Nonpaged Bytes
\Memory\Page Reads/sec
\Memory\Page Writes/sec
\Network Interface(*)\Bytes Received/sec
\Network Interface(*)\Bytes Sent/sec
\LogicalDisk(*)\Avg. Disk sec/Read
\LogicalDisk(*)\Avg. Disk sec/Write
\LogicalDisk(*)\Disk Read Bytes/sec
\LogicalDisk(*)\Disk Write Bytes/sec
Create the Collector Set Using the Template
- Download the template file, Delphix_perfmon.xml . Copy it to the host to be monitored.
- Import the file into Perfmon on the target host ( for example on the host machine hosting a SQL server vdb being investigated) via creating 'User Defined' collector set:
- Access Perfmon. Examples:
- Via Windows Search: Open the Start Menu, search for
Performance Monitor, and launch the Performance Monitor - Via Administrative Tools: Open the Control Panel and navigate to System and Security > Administrative Tools, then double-click the Performance Monitor shortcut.
- Via Windows Search: Open the Start Menu, search for
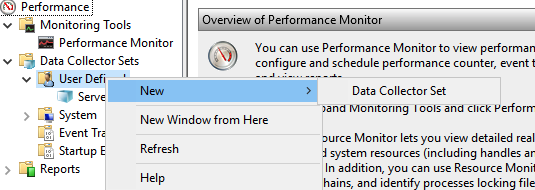
- Right-click User Defined under Data Collector Sets, and then click New.
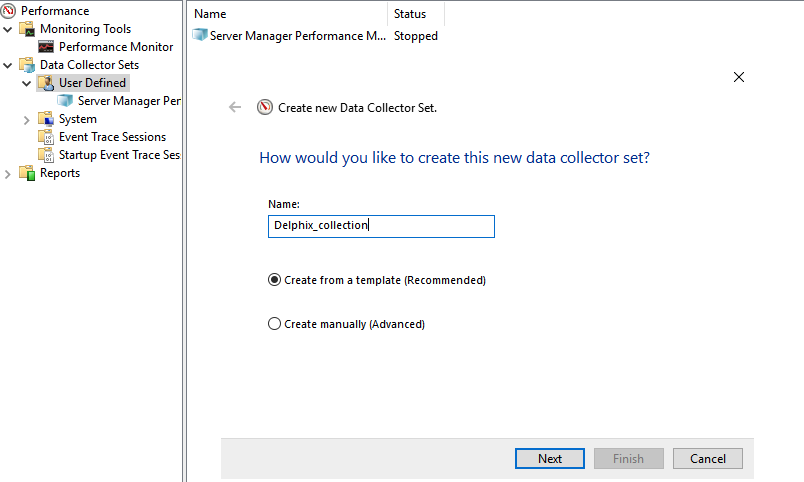
- On the Create new Data Collector Set dialog, provide a new name for the collector set and select Create from template.
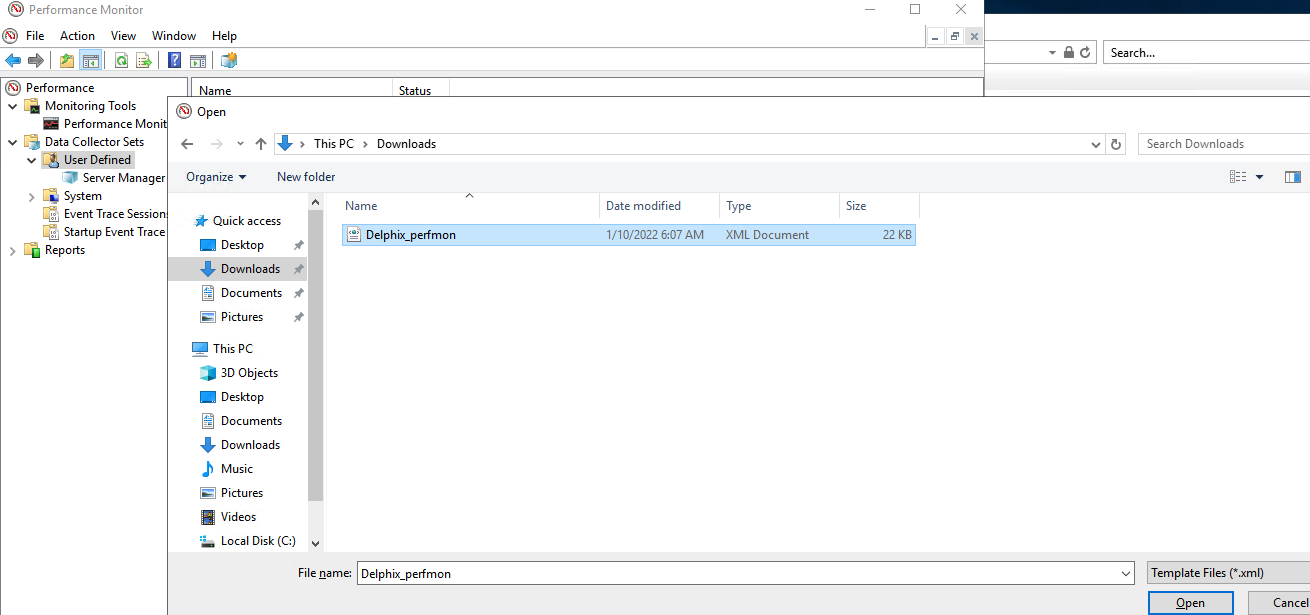
- Click Browse, and then find the template file provided above. Select the file and click Open.
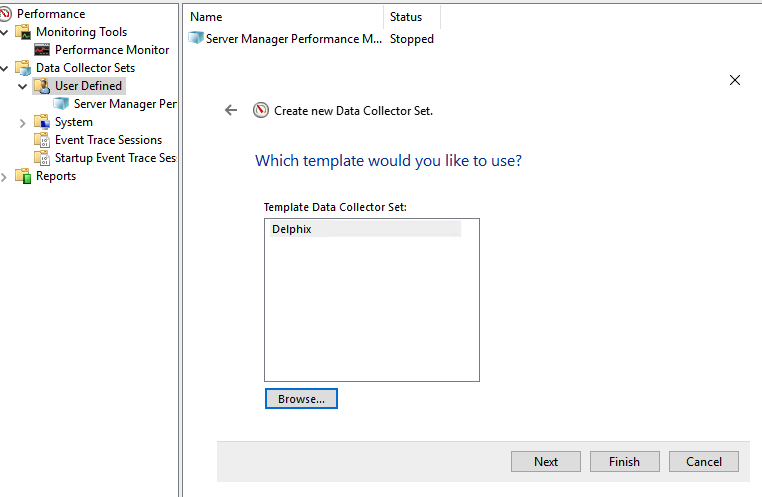
- Select the template and click Next.
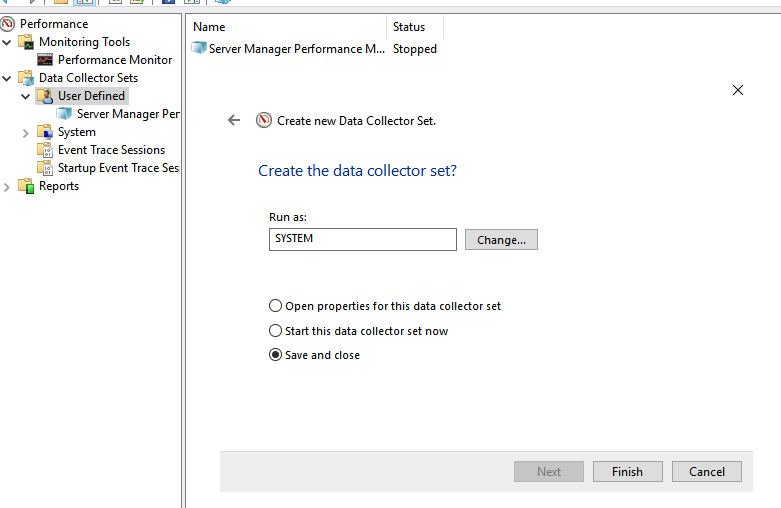
- Specify where the data/output file should be saved, click Next, specify which user you want to run Perfmon (one that has the correct privileges), then click Finish.
- Access Perfmon. Examples:
- Do not forget to change the output log format (right-click on the Data collector name, then click Properties) within the Performance Counters tab, change Log format to Comma Separated, and then and click Apply. Selecting comma separated results in a
.csvoutput file. - To start Perfmon metrics/counters data collection, right-click the Data Collector set, and then click Start.
- To stop collecting data, right-click on the Data Collector Set, and then click Stop.