Troubleshooting Masking Performance In-Place Oracle (KBA5985)
KBA
KBA# 5985
At a Glance
| Summary: | This KBA describes step-by-step troubleshooting procedures for Oracle on In-Place Masking jobs. This includes analyzing the Oracle Automatic Workload Repository (AWR) Report. |
|---|---|
| DIY Investigation: | Masking performance greatly depends on the Database and the Network. This includes how the data is stored and accessed.
These are the initial steps to verify performance:
See below for explanations and queries. |
| How to test if Update is bottleneck: | UPDATE is the likely bottleneck on any database. There is an easy way to verify this by using Custom SQL in the Rule Set. By changing the ROWID to NULL "ROWID", Oracle will update rows where ROWID=NULL. Note: Remember to delete or reset the Customer SQL after the test. If this is fast then the bottleneck is Update on the Oracle side SELECT NULL "ROWID", [masked columns] FROM [table] Note: No data will be masked since the UPDATE will not find any records where ROWID=NULL. |
| Delphix Support Investigation: | Steps to send a bundle to Delphix support:
Note: Remember to reset the Feedback Size (only) after creating the bundle. |
| Bottlenecks and actions: | After the investigations above, these are the possible next actions: SELECT (rare):
Masking (rare with recent v2 Out of the Box algorithms):
UPDATE (likely):
|
| More info: | More info on how to access logs:
Casting using SQL:
Oracle Driver Support Plugin (Enable Tasks - Indexes, Constraints, and Triggers) |
Applicable Delphix Versions
- Click here to view the versions of the Delphix engine to which this article applies
-
Date Release Sep 21, 2023 15.0.0.0 Aug 24, 2023 14.0.0.0 Jul 24, 2023 13.0.0.0 Jun 21, 2023 12.0.0.0 May 25, 2023 11.0.0.0 Apr 13, 2023 10.0.0.0 | 10.0.0.1 Mar 13, 2023 | Mar 20, 2023 9.0.0.0 | 9.0.0.1 Feb 13, 2023 8.0.0.0 Jan 12, 2023 7.0.0.0 Releases Prior to 2023 Major Release All Sub Releases 6.0 6.0.0.0, 6.0.1.0, 6.0.1.1, 6.0.2.0, 6.0.2.1, 6.0.3.0, 6.0.3.1, 6.0.4.0, 6.0.4.1, 6.0.4.2, 6.0.5.0, 6.0.6.0, 6.0.6.1, 6.0.7.0, 6.0.8.0, 6.0.8.1, 6.0.9.0, 6.0.10.0, 6.0.10.1, 6.0.11.0, 6.0.12.0, 6.0.12.1, 6.0.13.0, 6.0.13.1, 6.0.14.0, 6.0.15.0, 6.0.16.0, 6.0.17.0, 6.0.17.1, 6.0.17.2
5.3
5.3.0.0, 5.3.0.1, 5.3.0.2, 5.3.0.3, 5.3.1.0, 5.3.1.1, 5.3.1.2, 5.3.2.0, 5.3.3.0, 5.3.3.1, 5.3.4.0, 5.3.5.0, 5.3.6.0, 5.3.7.0, 5.3.7.1, 5.3.8.0, 5.3.8.1, 5.3.9.0 5.2
5.2.2.0, 5.2.2.1, 5.2.3.0, 5.2.4.0, 5.2.5.0, 5.2.5.1, 5.2.6.0, 5.2.6.1
5.1
5.1.0.0, 5.1.1.0, 5.1.2.0, 5.1.3.0, 5.1.4.0, 5.1.5.0, 5.1.5.1, 5.1.6.0, 5.1.7.0, 5.1.8.0, 5.1.8.1, 5.1.9.0, 5.1.10.0
5.0
5.0.1.0, 5.0.1.1, 5.0.2.0, 5.0.2.1, 5.0.2.2, 5.0.2.3, 5.0.3.0, 5.0.3.1, 5.0.4.0, 5.0.4.1, 5.0.5.0, 5.0.5.1, 5.0.5.2, 5.0.5.3, 5.0.5.4
Oracle Masking Performance
This Knowledge Article looks at how to troubleshoot Masking Performance on Oracle.
It will look at the masking operation (In-Place) per table and will target improving the masking rpm (rows per minute). The scope of the KBA is not to look at the time taken for other tasks such as Disabling/Enabling Constraints, Dropping/Creating Indexes, or Executing Pre/Post SQL Scripts though the AWR will likely have details about these too.
The steps in this guide can be performed with available tools and will help to determine and answer the following.
Is the bottleneck:
- Reading the data (SELECT)?
- Masking operation (algorithms and number of columns)?
- Updating the data (UPDATE)?
Note: Most of the time, the performance bottleneck is when Oracle is performing the UPDATE.
Performance factors
Some key factors to slow performance are:
| Database | Factors: | - Database IO Performance - Database WAITS (Log Switching, ITL Waits, ...) - Execution Plan and Indexes - the best is usually Full Table Scan - WHERE clause might use Index Scan - The number of records per block - Table-level fragmentation - Triggers and Indexes on masked tables and columns |
| Note: | A frequent cause of slow performance stems from the number of blocks accessed and updated. This can be due to execution plans, the data type and size, how it is stored, and table fragmentation. It can also be caused by Triggers and Indexes (including Constraints). | |
| Network | Factors: | - Latency - Throughput |
| Note: | This is rarely an issue as most masking engines are in the same Data Centre as the Database. | |
| Masking Operation | Factors: | - Number of Algorithms - Data Type (for example large Text Object) - Algorithm Type |
| Note: | The new algorithms (v2) are highly tuned and can mask multiple columns at a rate of many millions of rows per minute. |
Since AWR can be used to identify the bottleneck, let's jump straight into how to read key data from the AWR report.
Analyzing Oracle's AWR report
If the Masking Job is slow we can use the Oracle AWR to identify the bottleneck and where to look further.
- Note: the reason for Oracle being slow is outside the scope of Delphix and there can be many reasons. Please engage your Oracle DBA.
| Oracle AWR | ||
| SELECT (including COUNT) | UPDATE | Cause |
| Long elapse time | Short elapse time | Investigate SELECT. |
| Short elapse time | Long elapse time | Investigate UPDATE. |
| Short elapse time | Short elapse time | Investigate Masking Job. |
Capture the report
When capturing the AWR report, it is best to get the report from when the masking job starts. This will ensure that SELECT COUNT is included and this will ensure that Elapsed Time will be correctly measured.
A report that covers the complete masking job is the best but this might not be possible.
Here are some guidelines on what to capture:
- If the job is short (up to 30 min) - run the job to completion and capture the AWR report after the job.
- If the job is longer - you can cancel the job after 10-15 min and capture the AWR report.
- If the job has run for a long time, please provide the AWR report over a 1 hr time period from the masking job start time.
Key items
The key elements to look for in the AWR report are:
- 'Report Details' - the time period of the AWR report.
- Fore/Background Wait Events
- SQL ordered by Elapsed Time
- SQL ordered by CPU
- SQL ordered by Gets
- SQL ordered by Executions
- SQL ordered by Read
- Complete List of SQL Text
- Other key values
Notes:
- In the 'SQL ordered by' sections above, we can only see Reads since Oracle manages Writes behind the scene and if this is an issue, please consult your Oracle DBA.
- The number of Update Threads is not affect the AWR report (the number of rows is still COMMIT SIZE (default 10,000) per Commit).
Key AWR Report Sections
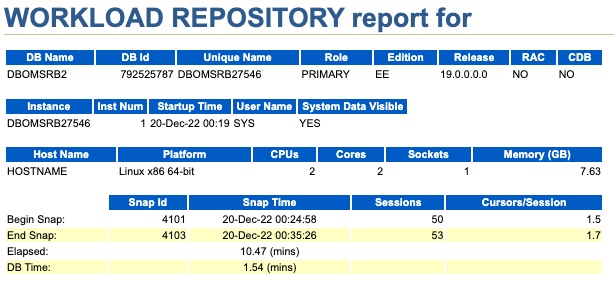
1. Report Details
Verify that the AWR report covers the correct time period by checking:
- Begin Snap and End Snap time
- Elapsed time
Example
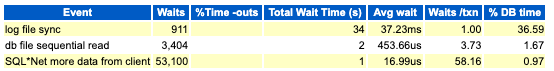
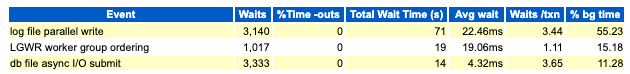
2. Fore/Background Wait Events
The second step is to check 'Foreground Wait Events' and 'Background Wait Events'. This might indicate Wait Events that may slow the UPDATE performance, as these are Events performed in the background on Oracle.
Check:
- Total Wait Time (compare that with the AWR time period)
- Avg wait
Check with your DBA for tuning recommendations.
Example
- The image below is just an example of what the list looks like - events will differ.
Foreground Wait Events
Background Wait Events
3. SQL ordered by Elapsed Time
This indicates SQL statements by Elapsed Time - slow performance means longer Elapsed Time. Fast SQL statements might not be included in the list.
Check:
- Elapsed Time
- SQL Text (and check SQL Id to see full SQL statement)
Should the SELECT top the list then this is likely the bottleneck and SQL tuning is needed (check execution plan). For example, this can be caused by a WHERE clause on a column that is not indexed.
Example
- The example below shows Elapsed Times from a good execution.
- In this case, all three queries that are used by the masking job are shown.

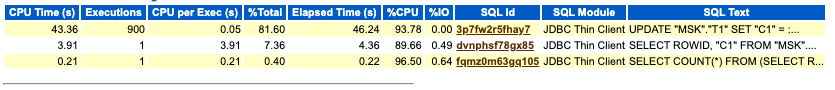
4. SQL ordered by CPU
'SQL ordered by CPU' will indicate which SQL statement is taking the most Oracle CPU time. If the masking-generated SQL statements are not at the top - this indicates that Oracle is busy processing other queries.
'Update' should be at the top.
Check:
- CPU Time (s)
- % Total
Example
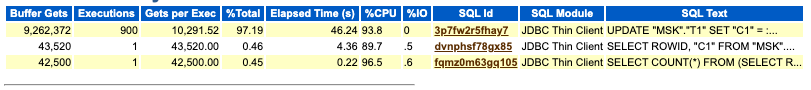
5. SQL ordered by Gets
Buffer Gets is a good estimate of the number of rows masked for the UPDATE statement. Each record updated will require 1 Buffer Gets (there will be some extra). SELECT will likely (and hopefully) perform a Full Table Scan (in that case the SELECT will retrieve multiple records per Buffer Gets).
Check:
- UPDATE
- Buffer Gets (eg. 9,262,372) - A good estimate of the number of rows masked (the actual number of records in this table is 9 million).
- Executions (eg. 900) - This is the number of Commits performed.
- Elapsed Time (eg. 46.24 sec) - Time the database spent on Foreground Tasks updating the records1.
- SELECT and SELECT COUNT
- Buffer Gets (eg. 43,520) - around 1 Buffer Gets per Block.
- Elapsed Time - The time the database spent on executing these SQL statements.
- Executions (eg. 1) - Confirmation only - should always be 1.
Note1: Elapsed Time excludes Background Events and time outside the database (for example network latency).
Executions and rows
The number of rows updated can be derived from Executions and Commit Size (from the Masking Job). Unless changed, the default Commit Size is 10,000. Buffer Gets will be slightly larger.
- Number of Gets > Number of Rows = Commit Size * Executions
- UPDATE Buffer Gets > 10,000 * 900 = 9,000,000
- Also, Gets per Exec > Commit Size.
Note: If Buffer Gets is much higher than the UPDATE Rows then this can indicate that Indexes or something else is also being modified when the data is Updated.
Performance calculations
Frequently, all SQL statements used in the masking job are shown in 'SQL ordered by Gets'. This makes it easy to see the Elapsed time. Using the Total Rows (from the Delphix Continuous Compliance Engine Monitor Page) the max RPM can be calculated for each step.
Important calculation note: In the calculations below we will use Buffer Gets as a rough indicator of rows and use that for SELECT as well. Select will have 20,000 (Row Limit) additional rows but on large tables this is negligible. For Select Count - we do know the total from the Job Monitor.
- Performance: (Rows or Gets) / Elapsed Time
- Oracle UPDATE performance1: 9,262,372 / 46.24 sec * 60 ~ 12 Million Rows/min
- Oracle SELECT performance1: 9,262,372 / 4.36 sec * 60 ~ 127 Million Rows/min
- Oracle COUNT performance: 9,000,000 / 0.22 sec * 60 ~ 2,455 Million Rows/min
The bottleneck is the lowest of the values above. Note that in this example, there is no performance issue - the Masking Job ran at 5.14 Million RPM. Why it wasn't 12 Million Rows/min is likely due to cascading masking operations, network latencies, and background Oracle operations. To improve this further will require fine tuning Oracle.
Note1: Use the same number of rows on both UPDATE and SELECT. The two steps are executed hand in hand with a few thousand records difference (these are records being masked in the masking job). Since we don't have an exact number for SELECT we use the number of records in UPDATE as an estimate.
Example
6. SQL ordered by Executions
This view will only have SQL statements with a lot of executions (like the Update). This view will show the number of records (rows) processed.
- UPDATE
- Executions (eg. 900) - This is the number of Commits performed.
- Rows Processed (eg. 9,000,000) - This is the total number of rows updated.
- Rows per Exec (eg. 10,000) - This should be the same as the Commit Size.
- SELECT and SELECT COUNT
- Note: Usually not listed here as 'SELECT' and 'SELECT COUNT' will only have 1 execution.

7. SQL ordered by Reads
This indicates how many blocks were read via physical reads (not in the buffer cache) per statement.
Key measurements:
- SELECT and SELECT COUNT
- Physical Reads - Reading and counting the records, there should be 1 Physical Read per block (could be less if there is an Index Scan).
- The data is stored in x number of blocks and the engine required x blocks to read the data (unless there is a WHERE clause).
- UPDATE
- Physical Reads - This is likely less than the number of blocks for the table (as blocks could be in SGA (memory)).
- Note: Indexes on masked columns will result in a much larger number of Reads and could be a root cause of performance issues.
8. Complete List of SQL Text
The section 'Complete List of SQL Text' should include the following SQL statements from the masked table.
The masking job will uses these three SQL statements per table:
- SELECT COUNT - this is the SQL counting the number of rows to mask.
- SELECT - this is the SQL for the 'Table input' step.
- UPDATE - this is the SQL for 'Update' step.
9. Other key values
These are some important wait events and statistics and what they mean. Small numbers will usually indicate that they are not significant (what is a small or large number and if they are significant depends on your Oracle environment).
- 'db file sequential read' means an Index was used.
- 'db file scattered read' indicates a 'Full Table Scan' (see below as well).
- 'control file sequential read' could indicate that a backup is running at the same time.
- 'table fetch continued row' - indicates chained or migrated rows (aka data fragmentation).
Other sections:
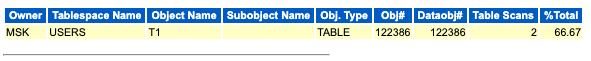
- 'Segment Statistics' - in this section, you should see your table - but look out for INDEX as this indicates an index fast full scan.
- 'Segments by Table Scans' - for most of the jobs - Oracle should do a full Table Scan.
Overview
The diagram below shows where the delays are accumulating to become slow performance.
.png?revision=1)
tother = Java, JDBC, etc.
- COUNT
- Typical: Full Table Scan (FTS), reads all blocks.
- tc = tlc + tdbc + tother
- SELECT
- Typical: Full Table Scan (FTS), reads all blocks.
- ts = tls + tdbs + tother
- MASKING
- tm
- UPDATE
- Uses System Global Area (SGA).
- Typical: Reads all blocks. AWR Gets is equal to updated rows.
- tu = tlu + tdbu + tother
The diagram excludes the throughput and the size of the data as this is normally not a performance-limiting factor. time tc (time to count) is only included for reference.
Masking performance will be dictated by compounding and capping factors based on the timing events above.
To improve masking performance, the current bottleneck needs to be found and resolved (and the process repeated if needed).
Masking Performance at different stages
The performance will differ at different stages of the masking job. These stages can be measured at the start of the masking job. Measuring these stages can help determine where the bottleneck is located.
Note: The performance can also be measured when the masking job finishes but this is usually not practical as the job has to finish successfully to collect these values.
An In-Place masking job execution has the following characteristics:
- SELECT
- The SELECT reads the dataset to be Masked.
- The first 10,000 to 20,000 records are normally read fast as the records are read into the masking engine's buffers.
- This is usually visible as a performance peak at the start of the job and shows the performance of the SELECT statement.
- Masking Transformation
- The SELECT is usually faster than the Masking operation.
- How fast depends on how many algorithms are used and the masked data.
- Update
- The last step is UPDATE.
- This is usually the performance bottleneck.
- The likely causes are the number of blocks/pages accessed and updated and the write performance of the database.
.gif?revision=1)
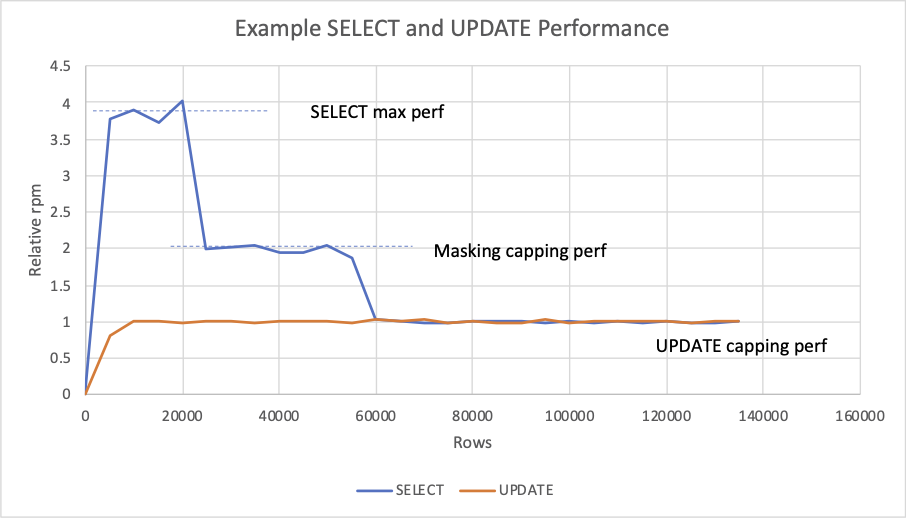
SELECT and UPDATE Performance Graph
By temporarily setting the Feedback Size = Commit Size to 10,000 and Row Limit = 200,000, the execution can be illustrated in a graph. This graph shows the performance as the buffers fill up and this will indicate the bottleneck.
An illustration of this can be seen below, which shows the job above. The graph shows the relative performance compared with the rpm of the overall masking job.
The characteristics are:
- The SELECT performance is initially the max performance that can be fetched from the database.
- As soon as the records start to appear and are masked they will be sent to the UPDATE step.
- The UPDATE performance is seen as soon as records are available to be updated.
- The SELECT will be at max speed until the initial buffers are full (around 20,000 - 30,0000 rows).
- The performance is then (in this case) capped to the performance of the masking operation.
- When all (relevant) buffers are full the SELECT step will be forced to the same performance as the UPDATE step.
Examples of Bottlenecks and Actions
No masking job is exactly the same and the characteristics will differ. With that said, the bottleneck can be identified in one of three areas.
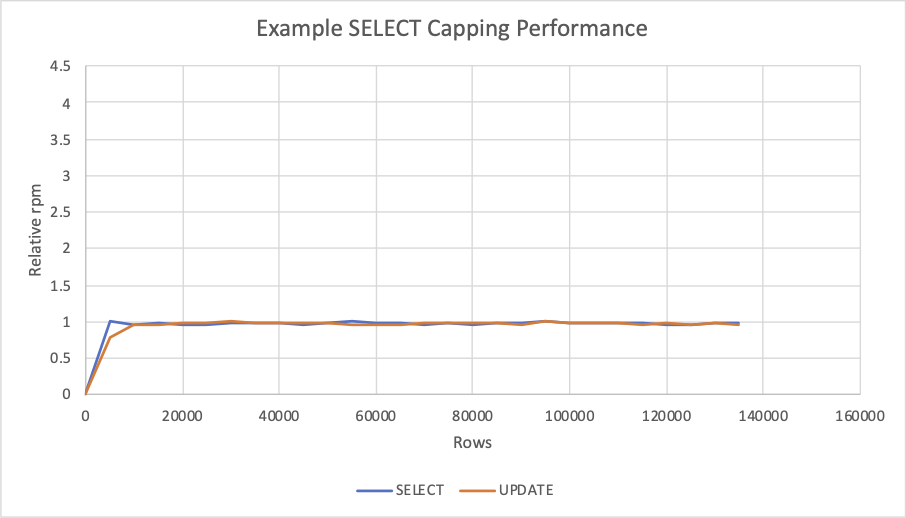
These areas are (with example graphs below):
Capped on SELECT
In this case, the performance will not be faster than the SELECT step and hence capped on SELECT.
Actions:
- Investigate the execution plan for SELECT and network latency.
- Investigate the amount of data (bytes) fetched per row. If there are Large Text or Binary objects consider using CAST in Custom SQL.
- If a WHERE clause is used consider indexing these column(s).
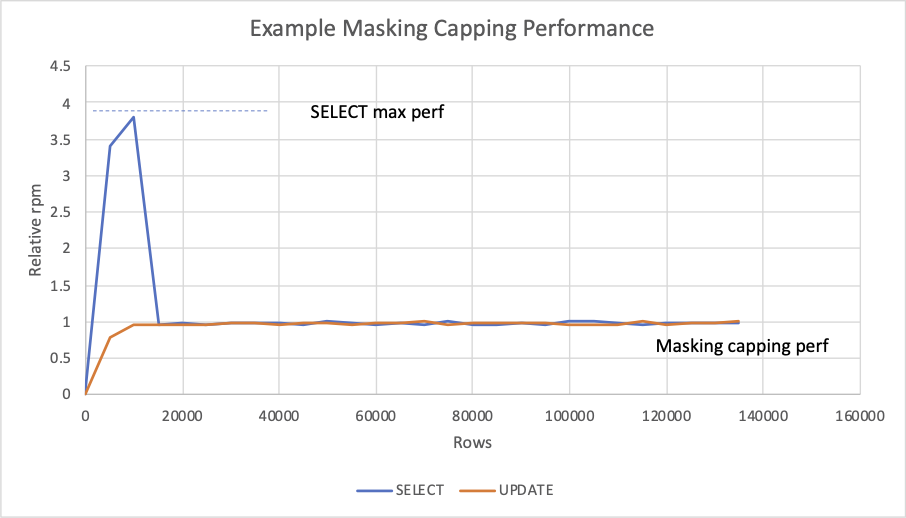
Capped on Masking
In this case, the SELECT will reach max performance until the initial buffers are full and then be capped by the masking operation.
Actions:
- Check the number of masked columns.
- Check the algorithms used (are they optimal for performance).
- Check the capacity of the masking engine (number of CPUs and Heap % used) - see KBA9461.
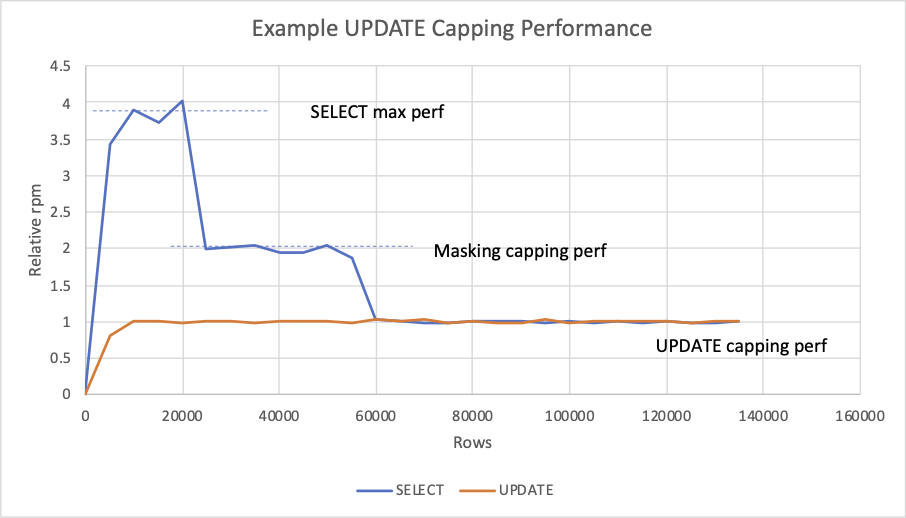
Capped on UPDATE
This is the performance case detailed above.
Actions:
- Investigate the details around UPDATE and other operations on the database. Check the AWR report to see if ROWID is used (default).
- Check if there are Indexes on Masked Columns and if there are these should be dropped.
- Check if there are any Triggers on masked tables. These need to be disabled.
 |
 |
 |
Collecting data
To find the bottleneck, we need to look at stats from each of these areas. There is no single report or query that will give the answer here. To find the root cause, we need all data.
Some points to remember:
- On the database, make sure to flush the buffer cache and shared pool before testing.
- To test masking performance, try masking using a fast algorithm (Character Mapping (CM) on Null SL).
- Running the job with Stream = 1 will help to isolate the table and the issue.
What to collect
The following information needs to be collected:
- Masking Rule Set and Inventory.
- For example: how many masked columns, algorithms, and column size.
- Database performance.
- The number of rows in the table.
- How long time does it take to run SELECT and UPDATE statements on the database?
- Any execution plan.
- Testing the masking performance.
- Temporarily set Feedback Size = Commit Size to 10,000 and Row Limit to 200,000.
- Test run the masking job.
- Remember to reset the Feedback Size to the original value (10,000 is too small for large jobs and will cause the logs to grow).
- Collect an AWR report for the masking job.
Checks to test Oracle performance
Check 1 - Network performance
Ping the Masking Engine from the Oracle Server and collect latency data. Run this a few times to get a good average value for the latency.
ping Your_Masking_Engine
Check 2 - Collect trace file and timing data
To know how fast Oracle can perform the statements on the database, we need to enable tracing and collect some data.
To collect the data, run the statement in the commands below:
- If possible, flush the cache and the shared pool before testing.
- Use SQLPLUS or another tool and log in as sysdba.
- Set up tracing and make note of the trace file name.
- Run the statements below for the Read and the Update.
- Exit SQLPLUS.
- Run tkprof on the collected trace file.
Flush cache and pool (requires dba)
alter system flush buffer_cache;
alter system flush shared_pool;
connect / as sysdba
set autotrace on statistics
Collecting the data
oradebug setmypid
oradebug tracefile_name
alter session set sql_trace=true;
set timing on
[Your Performance Statements]
exit
tkprof Your_Trace_File_From_Above.trc
Check 3 - SELECT Performance
The SELECT is here encapsulated in a SELECT COUNT to reduce the output size.
Actions
- Change YOUR_TABLE to the table to test.
- Take note of the number of records.
- Take note of the duration to complete this statement (in milliseconds).
Performance Statement
select count(*) from (select rowid from USER.YOUR_TABLE);
Database performance estimates
With the metadata above, the select performance can be calculated (note that this is the performance on the database and excludes network latency and java processing times):
- SELECT rpm: RowCount / Duration * 1000 * 60
- SELECT bpm: UsedBlocks / Duration * 1000 * 60
Check 4 - UPDATE Performance
The UPDATE performance is usually slower and the likely bottleneck. It is also harder to measure this as we can either do the test with UPDATE only (will be faster) or use a cursor with SELECT which will measure UPDATE and SELECT.
Actions
- Modify and use the SQL below.
- Change YOUR_TABLE to the table to test.
- Change MASKED_COL to the masked column (add multiple if multiple columns are masked).
- Take note of the number of records.
- Take note of the duration to complete this statement (in milliseconds).
Performance Statement (simple)
update USER.YOUR_TABLE set MASKED_COL = MASKED_COL WHERE ROWNUM < 500000;
Performance Statement (alternative using cursor)
- Modify the datatype for 'my_col1' to match one of the columns.
- For multiple columns add one per column.
DECLARE
   CURSOR c1 is
      select rowid, MASKED_COL from USER.YOUR_TABLE;
   my_col1 VARCHAR2(20);
   my_rowid VARCHAR2(20);
BEGIN
   OPEN c1;
   FOR i IN 1..50 LOOP
   FOR i IN 1..10000 LOOP
      FETCH c1 INTO my_rowid,my_col1;
      EXIT WHEN c1%NOTFOUND;
      update USER.YOUR_TABLE set MASKED_COL=MASKED_COL where rowid=my_rowid;
      COMMIT;
   END LOOP;
   END LOOP;
   CLOSE c1;
END;
/
Database performance estimates
With the metadata above, the UPDATE performance can be calculated. This includes rpm and bpm (rows and blocks per min) and is the performance on the database, excluding network latency and java processing times:
- SELECT rpm: RowCount / Duration * 1000 * 60
- SELECT ppm: UsedPages / Duration * 1000 * 60
Reading the trace file data
Example of a trace file.
- This is from 'SELECT COUNT(*)'
- 'Elapsed' time can be seen (Total).
- The number of blocks can be seen in 'Fetch'.
- 'Disk' will show how many blocks were read from the disk (this might be lower due to cache).
- 'Query' will show the actual blocks needed. This is the best value to use.
- The number of rows can be seen in the Masking UI or in the aggregate in the trace file (40,960 in the example below).
SQL STATEMENT ANALYZED

call     count       cpu    elapsed       disk      query    current        rows
------- ------  -------- ---------- ---------- ---------- ----------  ----------
Parse        1      0.00       0.90          0          0          0           0
Execute      1      0.00       0.00          0          0          0           0
Fetch        2      0.01       0.22        612        618          0           1
------- ------  -------- ---------- ---------- ---------- ----------  ----------
total        4      0.02       1.12        612        618          0           1

Misses in library cache during parse: 1
Optimizer mode: ALL_ROWS
Parsing user id: SYS
Number of plan statistics captured: 1

Rows (1st) Rows (avg) Rows (max)  Row Source Operation
---------- ---------- ----------  ---------------------------------------------------
         1          1          1  SORT AGGREGATE (cr=618 pr=612 pw=0 time=223635 us)
     40960      40960      40960   TABLE ACCESS FULL USERS (cr=618 pr=612 pw=0 time=102571 us cost=173 size=0 card=40960)
Collect data for Support Investigation
When opening a Masking Performance Support Case - please include:
- Table description (with Indexes, Constraints and Triggers).
- SELECT and UPDATE statistics collected from the database.
- Run a masking job with Feedback Size = Commit Size = 10,000 and Row Limit = 200,000.
- Upload a Support Bundle.
- Detail the Masking Job ID, Execution ID, and the table to investigate.
Related Articles
The following articles may provide more information or related information to this article:
- KBA: Best Practice: Masking Performance (Database) (KBA1561)
- KBA: Casting Values Before Masking (KBA1580)